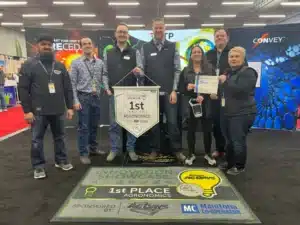
NutriScan Leaf Tissue Technology Wins First Place in Agronomics at the 2025 MB Ag Days Innovation Showcase
Photo: Ben Sherk, Aron Kathler, David Johnson, and Lori Andreosso of ATP photographed with MB Ag Days Innovation showcase judges. We are excited to share
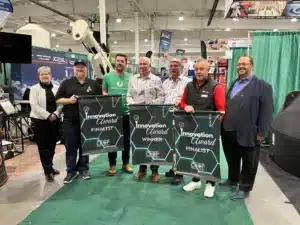
NutriScan Leaf Tissue Technology awarded TOP PRIZE at the Western Canadian Crop Production Innovation awards in Saskatoon!
The Innovation Award at the Crop Production Show recognizes groundbreaking products that address current and emerging needs in agriculture. Finalists are evaluated by a panel
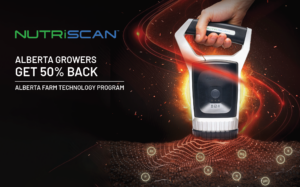
Alberta growers get 50% back on NutriScan with Alberta Farm Technology Program
Don’t miss out – Alberta growers get 50% back on NutriScan with Alberta Farm Technology Program! In case you haven’t heard – NutriScan has been